 Undergraduate Education of Food Science and Technology,TUST
IFT Competency Coverage Charts
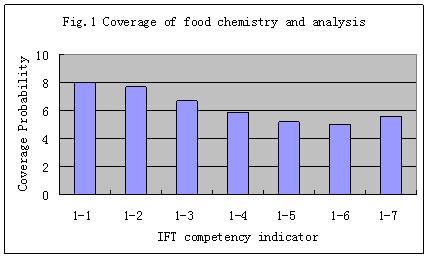
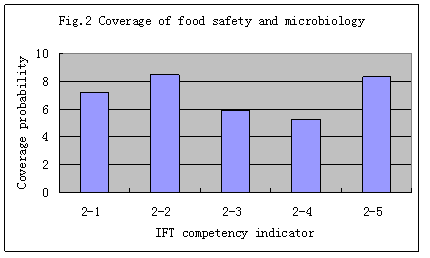


Coverage Probability (in row) =Cell Coverage Value×Cell Coverage Depth.
Cell Coverage Value includes E (introduce), C (cover to some extent) and D (cover in detail) where let E equal to 1, C equal to 2 and D equal to 3.
The Coverage Depth includes the Bloom Taxonomy's level from degree I to VI where let degree I equal to 0.1, degree II equal to 0.2 so on. In a cell of Competency Grid, the maximum is selected as Cell Coverage Depth.
TEDA Campus:No.29,13th.Avenue,Tianjin Economic and Technological Development Area(TEDA),Tianjin,China 300457